History Stats Value Widget
Used by: Analog Status tag, Counter tag, Digital Status tag, I/O tag, Rate of Change tag, Totalizer tag
* Does not use the Style Settings tag.
When linked to an analog or digital tag as its data source, the History Stats Value widget will display any one of a selection of statistics about that tag's value. The time span for the statistic must be specified by the operator. You can also allow them to display a different statistic.
The widget updates its value only when the dates are adjusted, and the selected dates are saved per-user session
The available calculations include:
- Time-weighted average - average value over a specified length of time.
- Minimum value during period
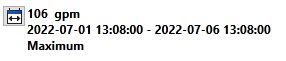
- Maximum value during period
- Value at start
- Count of zero to non-zero transitions (e.g. equipment starts)
- Non-zero time (example: total time that a pump was running during the period)
- Totalizer, calculated as the sum of the values logged during the time period. Note that this calculation differs substantially from that used by Totalizer tags.
- Change in value
The amount a value has changed over time. (In other words, the value at the end of a period minus the value at the beginning.) - Change in value with rollover
The amount a value has changed over time where the tag resets back to 0 each time it reaches a specified rollover value. Refer to the following discussion.
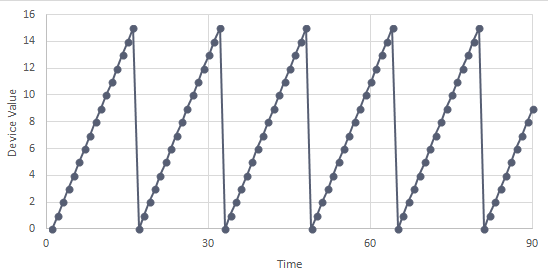
This is for hardware that can count to a limited number, then rolls over to start a fresh count. For example, a tag that counts equipment starts, but which can only count from 0 to 15 before wrapping around to start again. This gives a value of sixteen per roll-over since there must be one more start after fifteen to have the roll-over occur. A graph of a very simple case where there is a start every second would look like the following:
(Each rollover must be followed by a fresh start, not a gradually declining value. If there are a series of declining values then, because each is less than the previous, each counts as another rollover.)
The formula used is (RolloverCount * RolloverValue) + (LastValidValue - FirstValidValue).
Where, for any given time interval:
- Rollovers are counted when a new value is smaller than the last valid value.
- The RolloverValue is passed to the function in the parameter StaleTime.
- LastValidValue starts with the last valid value in the previous time interval (if any), and is updated with each new valid value within the time interval.
- FirstValidValue starts with the last valid value in the previous time interval (if any), and is updated with only the first valid value found in the current time span.
Given this example, suppose that you want a count of starts in each thirty-second interval. In the first interval there is no previous valid value, one wrap-around and a last valid value of 12. (1*16) + (12 - 0) = 28.
This is an idealized case. Consider a more realistic case where not all values are logged. (This may be due to factors such as polling intervals, deadbands, hardware, etc.) The following graph shows the same data where the orange dots represent values obtained and logged and the gray line represents what really happened:
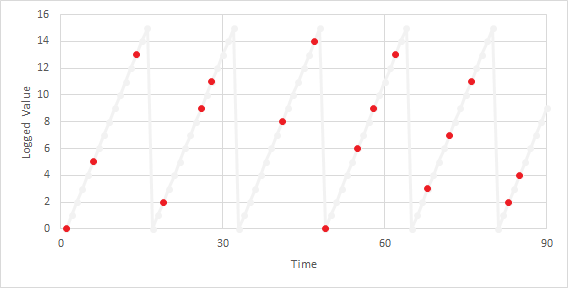
In the first 30 seconds there is one roll-over when the value drops from 13 to 2. The first value is 0 and the last is 11. The Historian will return 27: (1*16) + (11-0) = 27.
The Historian will return 30 for the period from 30 to 60. The first valid value (carried from the previous period) is 11. The last valid value is 9 and there are two roll-overs. (2*16) + (9-11) = 30.
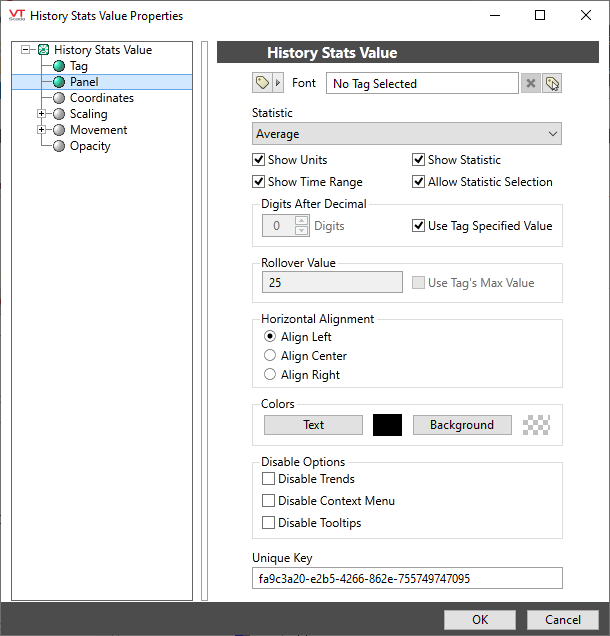
The properties dialog for the History Statistics widget:
Font
Select the font to be used when displaying this widget.
Statistic
Select one of the available statistics, as described earlier in this topic.
Show Units
Choose whether to display the engineering units of the linked tag.
Show Statistic
Choose whether to display the calculated statistic.
Show Time Range
Choose whether to display the time period for which the statistic was calculated.
Allow Statistic Selection
Allow operators to select which statistic to display when setting the time range.
Digits After Decimal
Select how many digits to display in the calculated value.
Rollover Value
Applies only when calculating Change in Value with Rollover.
The maximum value at which an increasing value will reset back to 0. This parameter will be ignored if the Use Tag's Max Value option is selected.
Use Tag's Max Value
Select to use a maximum value from the scaling tab of the tag's configuration as the rollover value. This may vary by tag type and configuration.
If the source tag is an IO tag, the Display Range Max parameter will be used if it is set. Otherwise, the Scaled Process Data Max value will be used.
If the source is an Analog Status tag, the High Scale Value will be used if it is set. Otherwise, the Scaled Process Data Max value will be used.
Horizontal Alignment
Choose whether to align text to the left, the center or the right of the area occupied by the widget.
Colors
Select the color of the text and the widget background. Defaults to black text on an invisible background.
Unique Key
Variables such as dialog positions and sizes are normally retained per-user and per-module. What this means for the History Statistics widget is that the user selections would be saved but shared across all these widgets.
By providing a unique key to this parameter, each History Statistics widget drawn in an application can save its own settings. If used, the key may be any phrase such as, "Main Station Display" or "Treatment Plant Panel", or the provided unique ID.
If the widget is used in a parameterized page, it will be necessary to have a different key for each version of the page that you open. Therefore, this property may be linked to a page parameter or expression.
Disable Options
Disable selected operator-interaction features of this widget.
See: Operator Interaction Controls
Text\History Stats Value
Analytics\Statistics\History Stats Value
