Pie Chart Widget
This widget can include any set of numeric tags, but cannot be linked to a tag.
* Does not use the Style Settings tag.
This widget is used to display the relative values of a set of tags in the form of a two-dimensional pie chart.
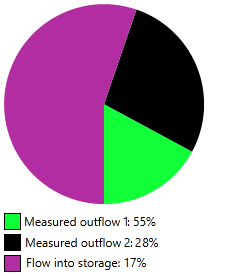
The chart updates continuously with changing values. The current sum of the included tags is taken as 100% and each slice of the pie represents the matching tag's contribution to that total.
The properties dialog for the Pie Chart widget:
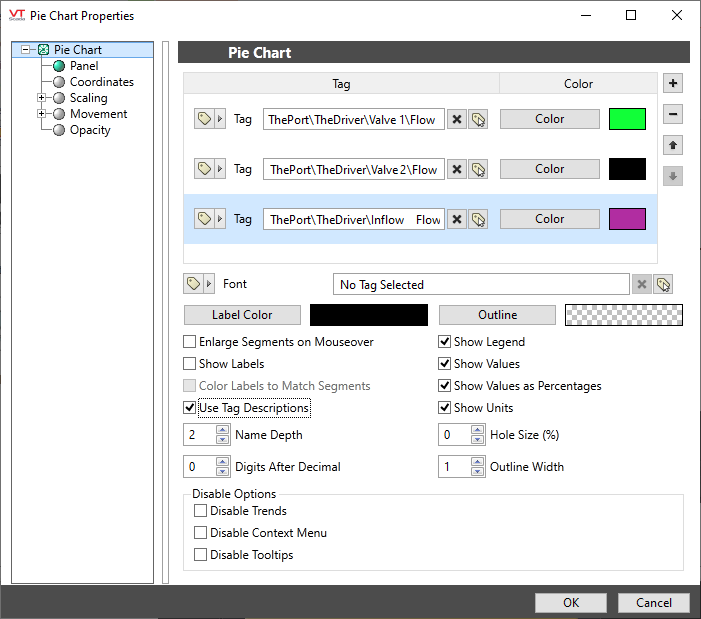
Tags
Use the + button to select all the numeric tags that should be included in the graph. Each defaults to the color black; you will need to select appropriate colors as you add the tags.
Use the - button to remove a tag from the set and the arrows to adjust the order.
Font
Select the font to use for labels and legends.
Label Color
Sets the color of all text used for labels, unless you choose to color labels to match segments.
Outline Color
Relevant only if the outline width is set larger than 0.
Enlarge Segments on Mouseover
When selected, each segment will be visually enhanced when under the mouse pointer.
Show Labels
When selected, labels are shown outside the chart, beside each matching segment. Content and color of the labels depend on the following selections:
Color Labels to Match Segments
If not selected, labels are shown in color set earlier.
Use Tag Descriptions
Applies to both labels and legends. If not selected, tag names are shown instead. For this case, the immediate (short) name of the tag is always shown. Names of parent tags are shown or not according to the following parameter:
Name Depth
Relevant only when Use Tag Descriptions is not selected (tag names are shown rather than descriptions). Minimum value of 1.
This controls how many of each tag's parents are included in the label.
Digits After Decimal
Applies to both labels and the legend. Defaults to 0 digits following the decimal.
Show Legend
Controls whether a legend is shown below the pie chart. The legend cannot be moved elsewhere.
Tag names or descriptions are shown depending on the earlier selection.
Show Values
Applies to both labels and the legend. Controls whether the values are shown as well as the tag names or descriptions.
Show Values as Percentages
Applies to both labels and the legend. If not selected, the current value of each tag is shown.
Show Units
Relevant only when showing actual values, not percentages. Applies to both labels and the legend.
Hole Size (%)
Defaults to 0 and has a maximum value of 99%. If non-zero, the chart is shown as a ring rather than a dot.
Outline Width (pixels)
When set larger than 0, every segment is bounded by an outline of the color set for all.
Disable Options
Disable selected operator-interaction features of this widget.
See: Operator Interaction Controls
Analytics\Charts and Graphs
