
* Can use properties from a Style Settings tag.
Used by: I/O and Calculations tag (although portions may be used by any analog numeric tag).
The spider graph widget allows operators to see at a glance whether several related tags have values below, within, or above their expected ranges.
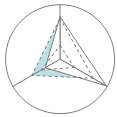
A spider graph showing three tags and their expected value range.
Unlike other widgets, which are linked to tags, you must use the selection tool in this widget's properties dialog to choose which tags to represent within the graph (choosing at least three). Any tag with a numeric value can be selected, but I/O and Calculation tags have expected range data.
You must select three or more tags to display within this widget. No useful information is shown with fewer than three tags.
Notes:
- As shown in this figure, each ray represents a tag, where 0% of the tag's scaled range is at the center and 100% of the scaled range is at the outer circle.
- Solid lines connect to the rays at a point representing each tag's current value relative to its scaled range.
(This is why you must include at least three tags to make the widget useful.) - The optional dashed lines connect to the rays at points matching the tag's expected values within its scaled range. Those values must be set in the tag's configuration dialog and exist only for I/O and Calculation tags. (see: I/O and Calculations tag: Scaling tab)
- The space between the dashed lines is shaded in order to improve visibility. The color of that shading is set in the Style Settings tag being used. (see: Style Settings Properties: High Performance tab)
- Selected tags are matched to rays as shown in the following properties dialog where the ray pointing up (north) matches the first tag in the list, the next ray clockwise matches the next in the list and so on.
- You are free to rotate the widget so that the first ray points in any direction.
- Labels (which are the tag's short name) can be shown for each ray. These are useful only if the selected tags have different short names.
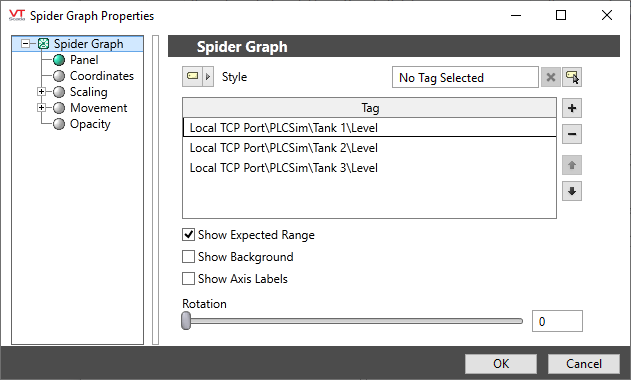
Configuration properties of the spider graph widget
Style
Refers to the selected Style Settings tag. If you have not selected otherwise, the default System Style Settings tag is used.
Tag
The list of tags whose values are shown in the graph. Use the + and - buttons to the right to add or remove tags. Use the up and down arrows to change the order, where the first tag in the list is drawn at the up or north direction and others proceed clockwise around the circle.
Show Expected Range
Draw the dashed lines and shading that represent the normal operating range of the tag. (Available only for I/O and Calculations tags.)
Show Background
Shade the entire widget using the background color configured in the Style Settings tag.
Show Axis Labels
Displays the tag's short name outside the circle near each ray.
Rotation
Turn the entire widget so that the ray representing the first tag in the list points somewhere other than the up (north) position.
Widgets\High Performance\Spider Graph
