Change Pen Styles
The Historical Data Viewer (HDV) chooses a unique color for each pen![]() 1) The line showing a tag's values in a graph within the Historical Data Viewer.
2) Private Enterprise Number used to plot a tag's values. Thin, solid lines are used, and each tag's plot will be adjusted so that the full range of scaled values fits within the window - with no regard to how that might overlap another tag's plot.
1) The line showing a tag's values in a graph within the Historical Data Viewer.
2) Private Enterprise Number used to plot a tag's values. Thin, solid lines are used, and each tag's plot will be adjusted so that the full range of scaled values fits within the window - with no regard to how that might overlap another tag's plot.
You may decide to emphasize one or more pens by selecting a color with greater contrast, setting a thicker line width or a different line style.
You can include more information in a plot by adding lines to show alarm set points - and thereby emphasize when the tag's values went into an alarm state. You can include peaks and averages, add value labels at key positions, scale the display, select extra information to include in the legend, and even change the graph's scale to be logarithmic.
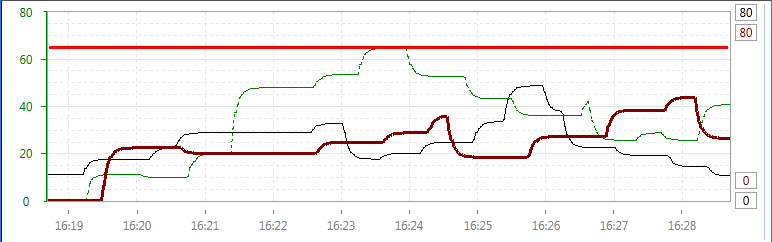
A variety of pen weights and styles
In all cases, adjustments are made by opening the pen's Properties dialog, which gives access to the full set of pen configuration controls. The legend configuration for each pen is remembered and used each time the associated tag is plotted in any instance of the Historical Data Viewer, regardless of how that instance is opened.
To open the properties dialog, do either of the following:
- Double-click the pen's entry in the legend.
- Click the gear icon for that pen's entry in the legend.
