Reports Page
You can generate reports using a variety of reporting formats provided with VTScada. In most cases, you will use the Reports page (a standard part of every VTScada application), but your application may have been created to generate reports automatically, or there may be buttons that you can press to create a predefined report on demand. This chapter describes how to use the Reports page. If other options exist, they will have been customized for your application - see your supervisor or VTScada Developer for more information about them.
VTScada provides an extensive set of tools for reporting, of which the Reports page is only one.
Report Page Features
In general, you will create reports by stepping through the numbered sections.
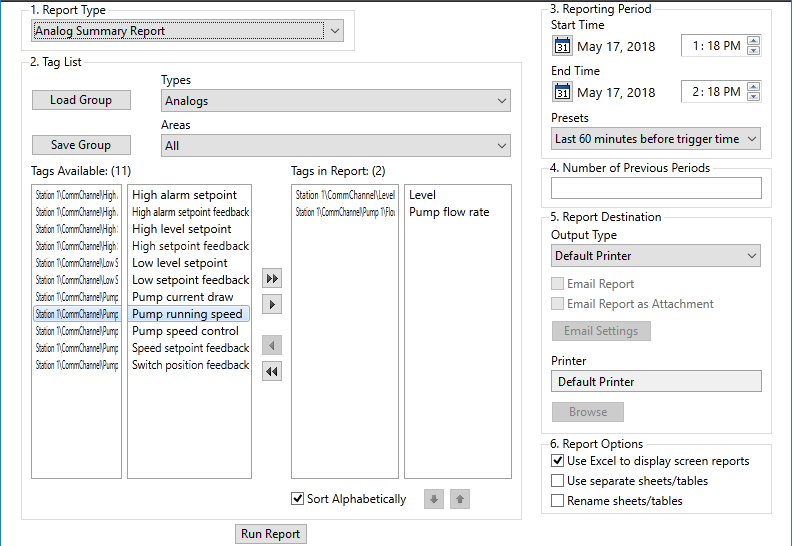
1) Selection of report type.
2) Tag List. Filters and other tools for choosing the tags that will be reported on.
3) Reporting Period. Choose one of the predefined periods or use the controls to set a specific start and end time.
Scheduled reports: Use Report tags to create these
4) Number of consecutive periods. After setting a report period, you can generate a series of reports, each for the same length of time, but for consecutive periods extending back in time. For example, seven consecutive one-day reports rather than one seven-day report.
5) Report Destination. Select from ten options for where the report will be sent or displayed after it has been generated.
If generating a file using the VTScada Anywhere Client, it will be transferred to your browser automatically. Check your browser's download history. (Will vary by browser.)
Only text files can be generated by a thin client, not spreadsheet or database files.
Similarly, Excel templates cannot be used when reporting via a thin client.
This applies to report generation, HDV exports, note exports, ChangeSet creation, and tag exports.
You cannot view a generated file (such as a report) within the Anywhere Client. The client shows only the VTScada user interface.
6) Other Report Options. Refinements that may be applied to some of the report destination choices.
The first option is to send a report to Excel, if available. The second and third options apply if previous periods are being generated (step 4) and the output is going to either Excel or Access format. Using separate sheets or tables for each iteration keeps the consecutive periods independent. If the Rename option is selected, you will be prompted for names when the report runs.
When running VTScada as a Windows service, DO NOT select Excel as an output destination or option from a Report Tag. As noted in the MSDN forums, office applications assume they are being run under an interactive desktop. If Excel attempts to open a modal![]() A modal dialog is always displayed on top of the calling window and prevents further interaction with that window. dialog from a non-interactive service, the result is an invisible dialog that cannot be dismissed, stopping the thread.
A modal dialog is always displayed on top of the calling window and prevents further interaction with that window. dialog from a non-interactive service, the result is an invisible dialog that cannot be dismissed, stopping the thread.
Besides the technical problems, you must also consider licensing issues. Microsoft's licensing guidelines prevent Office applications from being used on a server to service client requests, unless those clients themselves have licensed copies of Office. Using server-side Automation to provide Office functionality to unlicensed workstations is not covered by Microsoft's End User License Agreement (EULA).
Built-In Report Types
Refer to the reference chapter: Report Types Described
| Daily snapshot report | The value of selected tags at a particular time each day throughout the report period. |
| Daily total report | The sum of the values accumulated daily by each member of a selected set of tags within the time period you specify. Do not use with analogs that measure fluctuating values such as flow rates or levels. This report is to be used with values that are incrementing over a time period. For example, where the RTU or PLC includes a counter that increments whenever an event occurs such as a pump start or rain-gauge tip. These counters are finite and will reset to zero when the maximum value is reached on the device. This report will recognize a reset event and calculate for it. |
| Driver communication error detail report | A summary of error activity for a specified time period. Further information about these values is included in the VTScada documentation. |
| Driver communication summary report | A summary of driver activity for a specified time period, including response times, data quality, etc. Further information about these values is included in the VTScada documentation. |
| Hourly snapshot report | A snapshot of the value of each tag in a selected set of loggers at each hour within a specified time period. |
| Hourly total report | The sum of the values accumulated hourly by each of a selected set of tags within the time period you specify. Do not use with analogs that measure fluctuating values such as flow rates or levels. This report is to be used with values that are incrementing over a time period. For example, where the RTU or PLC includes a counter that increments whenever an event occurs such as a pump start or rain-gauge tip. These counters are finite and will reset to zero when the maximum value is reached on the device. This report will recognize a reset event and calculate for it. |
| Standard report | Raw data, as recorded from the selected tags. Note that for every timestamp in the report, there will be an entry for each selected tag, even though only one was likely to have saved a value at a particular timestamp. All other tags show the last recorded value prior to the given timestamp. |
| Analog summary report | Displays the average, minimum, maximum, and total values for a set of selected analog tags within a configured time period. When using this report to summarize flow data, set the Application Property, AnalogSummaryReportTimeUnits to the time unit used to measure the flow. If flow is measured in units per second, the property must be set to 1. If flow is measured in units per minute, the property must be set to 60. |
| Derived flow report | Displays the number of cycles for a driver, along with the inflow, outflow, and total flow for the station.
For this report, the tag selection area will be filtered to include drivers. The report must be run on a Polling Driver or Data Flow RTU, with at least one Pump Status tag. Tied to the Polling Driver, there must be an Analog Status with a description of "Well Volume" measured in gallons, that the well pumps in each cycle. This is usually the volume between the lead and stop float switches. This data must be entered in the manual data field of the Analog Status tag. |
| Detail report | Shows the values recorded for each selected tag, within the given time period. For Digital Status tags, if the Off Text / On Text parameters are configured, those values are shown rather than 0 and 1. |
| Email Excel Template |
Available only to applications built on the The Oil & Gas Solutions Layer.
|
| Overall Total | The sum of the values accumulated by each of a selected set of tags within the time period you specify. Do not use with analogs that measure fluctuating values such as flow rates or levels. This report is to be used with values that are incrementing over a time period. For example, where the RTU or PLC includes a counter that increments whenever an event occurs such as a pump start or rain-gauge tip. These counters are finite and will reset to zero when the maximum value is reached on the device. This report will recognize a reset event and calculate for it. |
| Pump activity report |
Displays data for the pump status tags in your application, enabling you to determine overall pump activity. Data includes count of pump starts, average run time, and total run time. The filter is set to I/O tags with the Pump equipment type, but may also use Pump Status and Digital Status tags. The pump activity and pump discrepancy reports will by default sort the tags being reported by Station Number and then by description alphabetically. To have the tags reported in the order provided to the report, set the property PumpReportSortPumps to 0. |
| Pump discrepancy report | Similar to the pump status report, but organized to allow you to analyze for inconsistencies. This report is designed to help you spot instances of pumps that should be identical in behavior, but are not. This report shows only the pumps that have a 20% or greater difference in running time or have more than 1 start count difference. |
| Rainfall report | Must be used with a DFS or Polling driver. Displays a per-tag summary of totals within the time period configured for the report, enabling you to determine the total rainfall for selected tags in a given period. The most common configuration is to use a Data Flow Pulse Input tag where each pulse recorded from the rainfall measuring equipment signifies a predefined depth measurement. |
