Historical Data Viewer (HDV)
VTScada makes it easy to view a trend plot of a tag's values over time. You need only left-click on an object that represents an input tag (analog or digital) to open a trend graph. Click more widgets to add more pens to the graph or use the Tag Selector button within the HDV toolbar.
All Notebooks that have the same Area as the tag you select on screen will be included.
You can control this by changing the properties IncludeAreaNotesWithTrendedTags, and IncludeGroupNotesWithTrendedTags.
If using the Tag Selector tool within the HDV, only notebooks that you add will be included.
You can also use the following options to open or view the HDV:
- The Historical Data Viewer Page, included in the Alarms, Reports and Diagnostics folder of the VTScada menu.
- Draw a button or hotbox that will open a preconfigured HDV as a pop-up dialog.
- Draw a miniature HDV on any page, configured as required.

Clicking a widget to open the HDV
Troubleshooting:
- Values are rounded to the nearest 1.
The I/O tag is configured for 0 decimal points. Open the tag's properties dialog and select the Display tab. Increase the decimal points to the value you want.
- Unable to see plotted values in the graph.
Check pen configuration to ensure that all are being plotted with a visible line.
Check that there are values for the selected pens. If all values are a flat line at the top or bottom of the range, they may not be easily visible. If the tags are not logged, it may be necessary to reduce the time scale to see live values being plotted.
If security groups and realm-area filtering are configured, you may not have the right to view the selected pens.
Developers can configure tags and widgets so that the HDV does not open in response to a click. This many have been done for selected tags and widgets in your application.
- The Historical Data Viewer doesn't open.
The developer may have disabled the trends feature for this tag. Check with your supervisor.
The item you clicked upon is not an input tag.
The ability to see the HDV is controlled by a security privilege that you may not have.
The HDV is already open but moved off to the side of the screen.
- Another window opened in addition to the HDV, perhaps blocking your view.
Every object in the location where you click, will respond - not just the top-most tag. - Ask your developer to adjust the screen layout or use the full Historical Data Viewer window rather than clicking on this tag.
Dealing with Daylight Savings Time:
VTScada records all data using UTC timestamps. In UTC, time advances at the rate of one second per second (barring leap-seconds) and if you were to plot your data against UTC time, you would see an uninterrupted line, assuming that your system is up and running, logging data.
Complications arise in places where daylight savings time (DST) is used. When DST starts in the spring, clocks jump forward from 2:00:00am to 3:00:00am. As far as UTC is concerned, data continues to be logged at the same rate, but if viewed on a graph that shows the local time, there will be a gap or a straight line showing no data for that hour. This is not a problem with VTScada. The gap exists because no time passed when the clock jumped forward, and therefore there is no data for that hour. Nothing can be shown.
Also, that day is 23 hours long, not 24, which may affect your reports. Again, this is not a problem with VTScada. According to your local clock, the DST-transition day had only 23 hours, therefore a daily report can include only 23 hours worth of data.
In the autumn, when daylight savings time ends, you can expect the same in reverse. It will appear that an hour's worth of data is over-written during the transition as the local clocks repeat that hour. That day is 25 hours long.
Rest assured that VTScada is faithfully and steadily recording your data, regardless of what your local clocks are doing.
If the tag is being logged, the graph can be scrolled to show historical information. If there is no saved data, then the graph will show only new values as they are being collected. The HDV makes it clear whether the plot is of live (current) or of historical values. While you are viewing live data, the pause button (following image) will look like any other button. While you are viewing only historical data, the button will be an arrow on a yellow background.
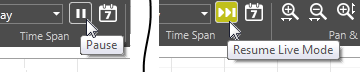
Controls to pause and resume live data display
The pen legend, across the lower edge of the window, provides a color-key to the plot lines, value statistics for the time span shown and controls to hide a plot line or change its display characteristics. The Value column tracks the cursor position across the graph, showing the matching values as you move the cursor across the chart.
Besides being opened by a click on a widget, the HDV page can usually be found in the menu. Your application may also have shortcut buttons that link to the HDV, loading a preset group of pens.
When opening the HDV directly from the menu, you will need to select a set of tags to plot after the page opens. See: Select Pens (Tags) to Plot.
The HDV's features include the ability to plot multiple tags, save named groups for easy selection later, adjust the color, size and style of the graph lines, add notes, superimpose lines to mark alarm levels, view a table of the values, export, and much more.
Certain tasks described in this chapter require that you first select a pen. You can do so either by clicking the pen name in the legend, or by clicking once on a value in its scale legend, to the right or left of the graph.
Graphed Lines versus Logged Values
The Historical Data Viewer's plot display cannot show more data than there are pixels on your computer screen. For example, your display might have 1024 pixels across its width, of which 1000 or so are devoted to the display of the graph. If you are viewing a week's history for a tag that is logged every 10 seconds, there are 60480 records in the log file for the week. Each pixel on the graph must therefore represent approximately 60 logged values.
The following techniques are used to deal with this:
Analog Pens: Peaks and Averages. If the Plot Averages option is selected for a pen (tag) then for each pixel on the graph, the average of the logged values represented by that time span will be shown. If the Plot Peaks option is selected, then the minimum and the maximum values for the time span will both be shown, resulting in a banded plot. You can choose to plot Peaks and Averages at the same time.
You can control the default scale range for analog pens. The scale can be set in the tag configuration, within the pen properties, or allowed to float, automatically adjusting to the currently displayed values.
Digital Pens: In the legend, "Average" refers to the percentage of the displayed time for which the tag was in state 1 ("On"), expressed as a decimal value.
In the grid view, when viewing averages over a time span that is greater than the logging rate, a % active value will show you what percentage of the logged values within that time span had a value of 1.
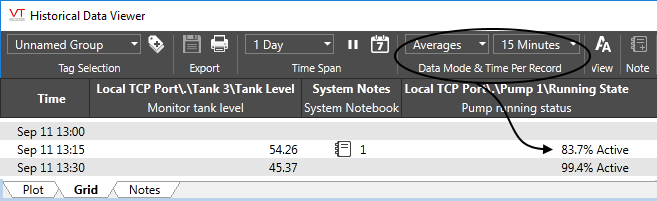
To view the history of actual on and off cycles, select the Raw Data option from the menu.
