
A Better Way to Display Historical Trends
Historical Data Viewer (HDV)
An advanced historical trend viewer is a part of every VTScada application. The HDV combines historical data logs with real-time data to display a continuous picture of any number of I/O values over time.
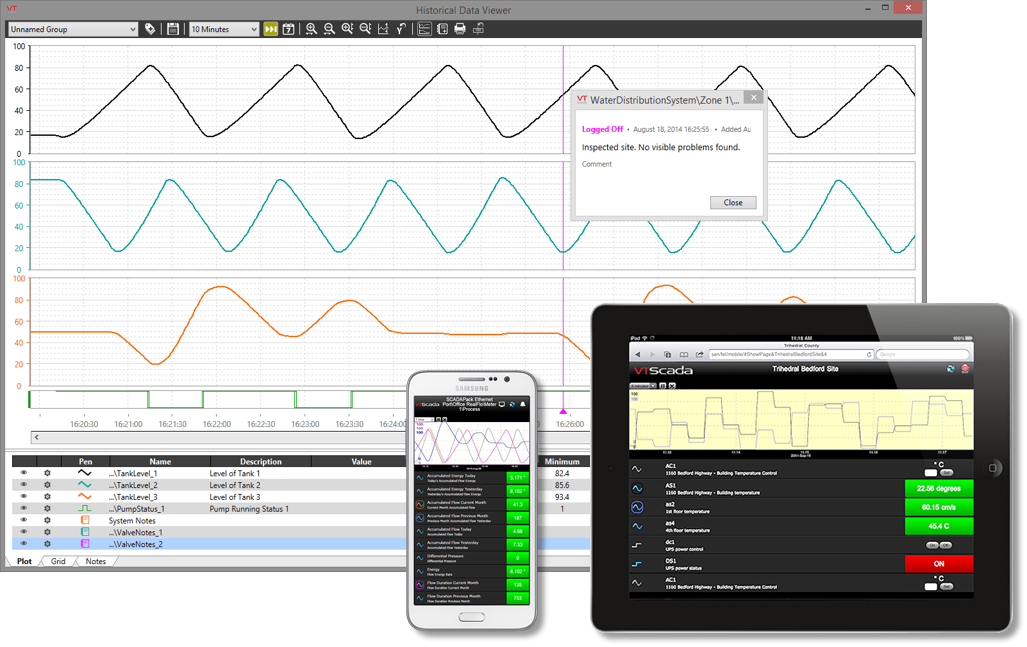
See analog and digital data displayed simultaneously in either trend view or tabular format. Add or remove tags as necessary and independently adjust each one’s color and thickness.
Operator Configurable Groups
Click on any meter, readout or switch to open a SCADA historical trend viewer in a separate window. Add more values by clicking other tag-driven graphics or by using the simple tag picker. Once you have adjusted the color and thickness of each value, you can easily save them as a group for easy recall anytime.
- Easily export any range of data to a file or database
- Add encrypted operator notes to points on the timeline
- Displays min, max and average values
- Supports logarithmic scaling