
Not counted towards your tag license limit.
Each instance of a History Statistics tag will perform 7 statistical calculations, using the data collected from a numeric tag's value over a defined time period. History Statistics tags complement, rather than replace, Totalizer tags and Counter tags. The result of only 1 calculation will be shown, but you may display other calculations by linking other History Statistics tags to the first - these will simply take the result of the requested calculation from the first tag rather than performing calculations of their own.
History Statistics tags work by querying the saved history of the tag they watch. This query happens on startup and at every multiple of the update rate. If you create a large number of History Statistics tags you can expect system performance to slow accordingly.
History Statistics tags may be useful for screen displays. They are not required for reporting purposes.
The available calculations include:
- Time-weighted average - average value over a specified length of time.
- Minimum value during period
- Maximum value during period
- Value at start
- Count of zero to non-zero transitions (e.g. equipment starts)
- Non-zero time (example: total time that a pump was running during the period)
- Totalizer, calculated as the sum of the values logged during the time period. Note that this calculation differs substantially from that used by Totalizer tags.
- Change in value
The amount a value has changed over time. (In other words, the value at the end of a period minus the value at the beginning.) - Change in value with rollover
The amount a value has changed over time where the tag resets back to 0 each time it reaches a specified rollover value. Refer to the following discussion.
Any numeric tag may be used as the data source, so long as its value is logged.
When counting non-zero time, note that logged INVALIDS are counted as zero. If equipment goes offline (or appears to) this may cause the History Statistics tag to report a shorter run time than expected.
Statistics are collected over a given duration of time (the Manual Data Period option in the tag's configuration). You provide the length of the time period and the frequency at which the display is to be updated. Time durations fall on regular clock intervals. For example, a manual data period set for the latest 1 hour, updated every 15 minutes, will use logged data for the 60 minutes prior to the most recent quarter-hour mark.
The calculated value of the History Statistics tag can be displayed on a page using any of the Analog widgets. While a History Statistics tag can be selected for inclusion in the Historical Data Viewer (HDV), clicking on one that is drawn on a page will not cause the HDV to open. Note that if you want to save the values calculated by the History Statistics tag, you will need to select an Historian to use for the built-in connection.
Values are not logged by default, but can be by attaching an Historian. If logged, the timestamp recorded for each calculated time span will match the start time, not the end time.
Change in value with rollover
This is for hardware that can count to a limited number, then rolls over to start a fresh count. For example, a tag that counts equipment starts, but which can only count from 0 to 15 before wrapping around to start again. This gives a value of sixteen per roll-over since there must be one more start after fifteen to have the roll-over occur. A graph of a very simple case where there is a start every second would look like the following:
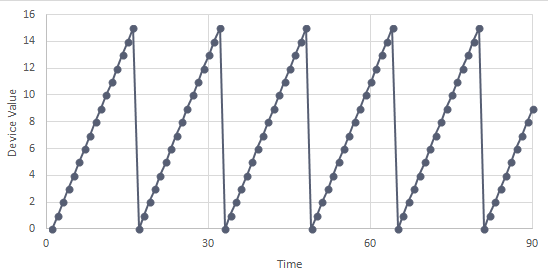
(Each rollover must be followed by a fresh start, not a gradually declining value. If there are a series of declining values then, because each is less than the previous, each counts as another rollover.)
The formula used is (RolloverCount * RolloverValue) + (LastValidValue - FirstValidValue).
Where, for any given time interval:
- Rollovers are counted when a new value is smaller than the last valid value.
- The RolloverValue is passed to the function in the parameter StaleTime.
- LastValidValue starts with the last valid value in the previous time interval (if any), and is updated with each new valid value within the time interval.
- FirstValidValue starts with the last valid value in the previous time interval (if any), and is updated with only the first valid value found in the current time span.
Given this example, suppose that you want a count of starts in each thirty-second interval. In the first interval there is no previous valid value, one wrap-around and a last valid value of 12. (1*16) + (12 - 0) = 28.
This is an idealized case. Consider a more realistic case where not all values are logged. (This may be due to factors such as polling intervals, deadbands, hardware, etc.) The following graph shows the same data where the orange dots represent values obtained and logged and the gray line represents what really happened:
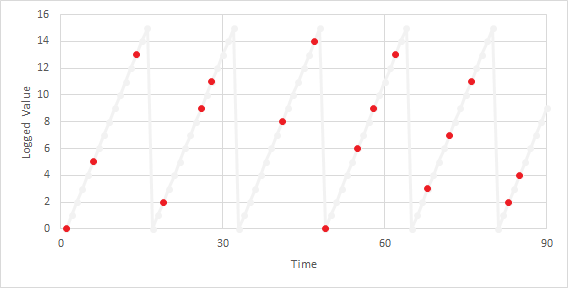
In the first 30 seconds there is one roll-over when the value drops from 13 to 2. The first value is 0 and the last is 11. The Historian will return 27: (1*16) + (11-0) = 27.
The Historian will return 30 for the period from 30 to 60. The first valid value (carried from the previous period) is 11. The last valid value is 9 and there are two roll-overs. (2*16) + (9-11) = 30.
Rollover Value
The maximum value at which an increasing value will reset back to 0. This parameter will be ignored if the Use Tag's Max Value option is selected.
Use Tag's Max Value
Select to use a maximum value from the scaling tab of the tag's configuration as the rollover value. This may vary by tag type and configuration.
If the source tag is an IO tag, the Display Range Max parameter will be used if it is set. Otherwise, the Scaled Process Data Max value will be used.
If the source is an Analog Status tag, the High Scale Value will be used if it is set. Otherwise, the Scaled Process Data Max value will be used.
An I/O tag in Calculation mode always has an invalid ScaledMax, therefore Display Range Max must be set.
The ID tab of every tag includes the same common elements: Name, Area, Description, and Help ID.
Name:
Uniquely identifies each tag in the application. If the tag is a child of another, the parent names will be displayed in a separate area before the name field.
You may right-click on the tag's name to add or remove a conditional start expression.
Area
The area field is used to group similar tags together. By defining an area, you make it possible to:
- Filter for particular tag groups when searching in the tag browser
- Link dial-out alarm rosters to Alarm tags having a particular area
- Limit the number of tags loaded upon startup.
- Filter the alarm display to show only certain areas.
- Filter tag selection by area when building reports
When working with Parent-Child tag structures, the area property of all child tags will automatically match the configured area of a parent. Naturally, you can change any tag's area as required. In the case of a child tag, the field background will turn yellow to indicate that you have applied an override. (Orange in the case of user-defined types. Refer to Configuration Field Colors)
To use the area field effectively, you might consider setting the same Area for each I/O driver and its related I/O tags to group all the tags representing the equipment processes installed at each I/O device. You might also consider naming the Area property for the physical location of the tag (i.e. a station or name of a landmark near the location of the I/O device). For serial port or Roster tags, you might configure the Area property according to the purpose of each tag, such as System or Communications.
You may define as many areas as you wish and you may leave the area blank for some tags (note that for Modem tags that are to be used with the Alarm Notification System, it is actually required that the area field be left blank).
To define a new area, type the name in the field. It will immediately be added. To use an existing area, use the drop-down list feature. Re-typing an existing area name is not recommended since a typo or misspelling will result in a second area being created.
There is no tool to remove an area name from VTScada since such a tool is unnecessary. An area definition will exist as long as any tag uses it and will stop existing when no tag uses it (following the next re-start).
Description
Tag names tend to be brief. The description field provides a way to give each tag a human-friendly note describing its purpose. While not mandatory, the description is highly recommended.
Tag descriptions are displayed in the tag browser, in the list of tags to be selected for a report and also on-screen when the operator holds the pointer over the tag’s widget. For installations that use the Alarm Notification System, the description will be spoken when identifying the tag that caused the alarm.
The description field will store up to 65,500 characters, but this will exceed the practical limits of what can be displayed on-screen.
This note is relevant only to those with a multilingual user interface:
When editing any textual parameter (description, area, engineering units...) always work in the phrase editor. Any changes made directly to the textual parameter will result in a new phrase being created rather than the existing phrase being changed.
In a unilingual application this makes no difference, but in a multilingual application it is regarded as poor practice.
Help Search Key
Used only by those who have created their own CHM-format context sensitive help files to accompany their application.
History Statistics properties Source Settings tab
Use this tab to select the logged tag whose value is to be used for the calculation, and the particular calculation to be performed by this instance of the History Statistics tag.
Every standard VTScada tag has only one source variable that can be used for the calculation: its value. Custom tag types may expose other variables that can be used in the calculation.
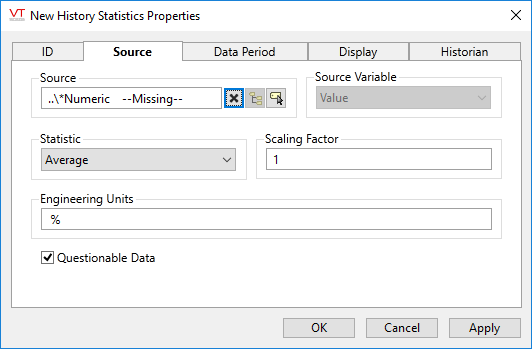
Source
Select the tag whose value (or other source variable) is to be used in the calculation. All numeric tag types are available. By default, the nearest Numeric parent tag will be selected. You can select another History Statistics tag here if you wish to display a different one of its 7 calculations. Selecting another History Statistics tag as the data source will disable the Data Period options for this tag instance.
Source Variable
For all standard VTScada tags, the only source variable is the tag's value. Custom tags, written specifically for your application, may make other variables available. If so, the drop-down list will be populated with the available choices.
Statistic
Select the calculation to be performed from the following list:
- Average - time weighted average over the data period.
- Minimum value during the data period.
- Maximum value during the data period.
- Value at start of the data period.
- Zero to non-zero transitions during the data period.
- Non-zero time. Example: total time that a pump was running during the period.
- Totalizer - the sum of the values collected during the data period.
- Change in value - the amount a value has changed over time.
- Change in value with rollover - See notes at the beginning of this topic.
Difference from the Totalizer tag:
The Totalizer tag calculates a time-weighted integral of the values collected. The totalizer option of the History Statistics tag provides a sum of the values within the time interval. Both have their uses.
Scaling Factor
The calculated value will be multiplied by the factor you specify in this field. Use for applying a scaling factor to the value, for example if correcting for raw values that are measured in terms of minutes or hours instead of seconds. Defaults to 1.
Engineering Units
Text that will indicate to operators what the value of this tag means.
Questionable Data
Use this field to flag the tag’s data in the event that you suspect the values it is reporting might not be correct, or when this tag has initially been created and you wish to ensure that its data is marked for extra monitoring.
History Statistics properties Data Period tab
This panel is used to set the length of the calculation period, and the rate at which the calculation is updated.
If another History Statistics tag has been selected as the data source, all fields in this panel will be disabled. The source History Statistics tag will control the data period.
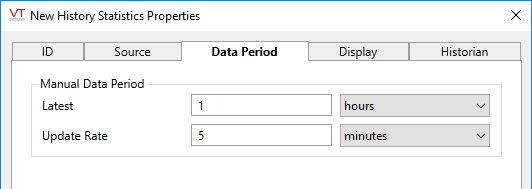
Latest
Use the text field to set a number of time units. The statistic calculation will use data from this length of time, measured to the nearest clock interval as controlled by the update rate.
Update Rate
Sets the frequency at which the statistic is recalculated. The calculation will always use data from the full length of time specified by the Latest field, ending on the clock interval specified by this update rate. For example, if the update rate is 5 minutes, the update will occur at the 5 minute mark, 10 minute mark, etc.
The update rate must not be greater than the duration of time over which the statistic is being calculated, and can be no smaller than 0.1% of that time period.
If a parameter expression is used for either of these two values, the units will always be seconds. The time unit selection tool will be disabled.
When this tag is represented on screen by widgets that can use a Style Settings tag, you can save development time by choosing the Style Settings tag that holds the correct display configuration for this tag instance.
The default configuration will use System Style, the default style tag that is automatically part of every new VTScada application.
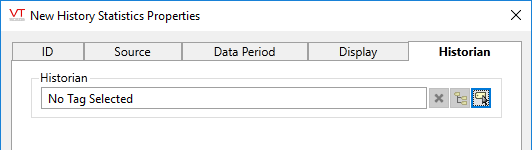
History Statistics properties Historian tab
Optionally, link an Historian tag to this History Statistics tag to save a record of the summary data calculated by the History Statistics tag. Logging is done at the interval configured in the data period tab. In a multi-server application, logging is broadcast to all machines running the application.
Note that the History Statistics tag uses logged data for its calculations, thus logging the result of those calculations is redundant. Doing so may simplify later report generation, but at the cost of increased storage.
If logging is enabled by attaching an Historian, note that the timestamp of each recorded value will match the beginning of the configured time span, not the end.
The following widgets are available to display information about your application’s History Statistics tags:
